Independent guide · Casino
Online Gambling Growth: What the Numbers Really Mean
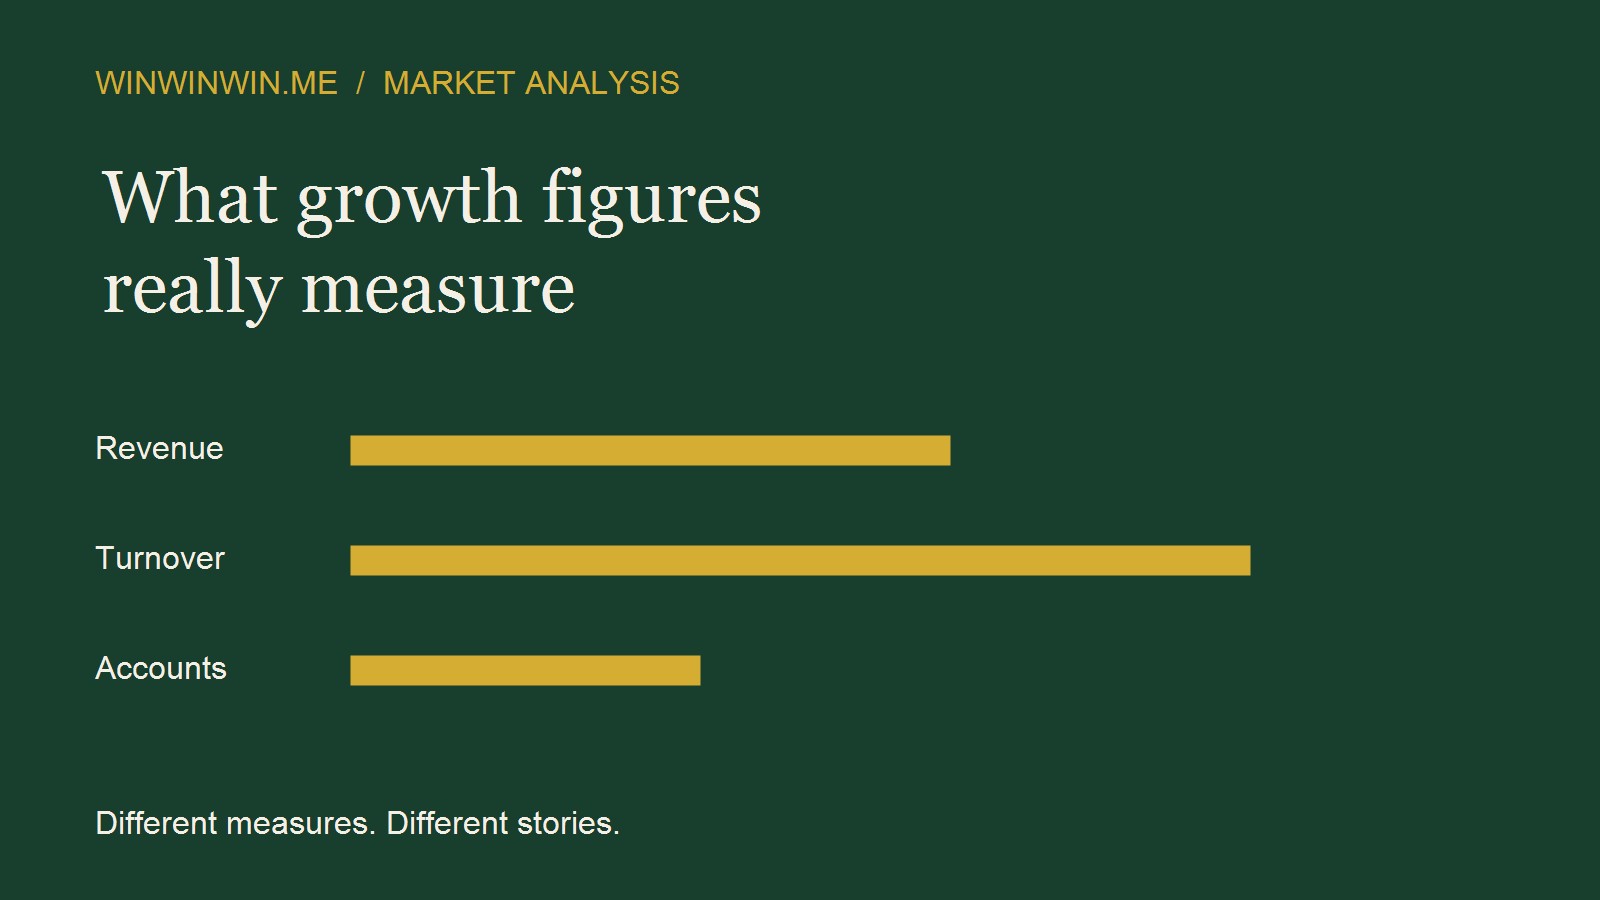
Casino revenue, betting turnover and accounts measure different things. Read British market figures without confusing growth with player returns.
Why this matters
Online gambling growth measures money moving through an industry; it does not tell a player that a game offers better returns. That distinction gets lost when a headline puts casino revenue, betting activity and customer numbers into the same sentence.
What the latest annual figures actually say
The Gambling Commission's annual report, published on 17 September 2026, covers April 2025 to March 2026. Remote casino, betting and bingo generated £8.3 billion in gross gambling yield, up 6.9% on the previous financial year. Online casino accounted for £5.7 billion, including £4.8 billion from slots. Remote betting generated £2.4 billion. New remote account registrations fell 3% to 32.4 million. These are reported British market figures, not forecasts. Source: annual industry statistics.
The editorial point is limited but useful: revenue growth and registration growth need not move together. Those figures alone cannot establish whether a change came from customer spending, product mix, outcomes or another cause.
Four numbers that should stay separate
Measure — Question it helps answer — Common misreading
Stakes or turnover — How much was wagered? — Treating every wager as a fresh deposit
Gross gambling yield — What did operators retain from gambling activity under the reporting rules? — Calling it profit after business costs
Active accounts — How many accounts met the activity definition? — Calling them unique people
Registrations — How many new accounts were opened? — Assuming they all became active customers
How £100 can produce £300 of wagers
Consider a simplified, hypothetical record, with no bonus or fees. A customer deposits £100 and wagers it. The bets return £80 in total, including any returned stakes. The customer wagers that £80 and receives £70, then wagers £70 and receives £50, then wagers £50 and receives £40. The remaining £40 is withdrawn.
No extra deposit was needed to create £300 of turnover. The same balance was reused. This example is bookkeeping, not a forecast or a formal regulatory return. Its purpose is to show why turnover is a poor substitute for the amount a customer brought to the site.
Total stakes: £100 + £80 + £70 + £50 = £300; Total payouts: £80 + £70 + £50 + £40 = £240; Stakes less payouts: £300 − £240 = £60; Customer cash result: £40 withdrawn − £100 deposited = −£60
Casino and sports betting can move in different directions
A separate Commission dataset illustrates the problem with a single growth headline. For October to December 2025, online slots yield rose 10% year on year, while real-event betting yield fell 18%. Total online yield fell 2%, although bets and spins rose 6%. The release covers the largest operators and explicitly warns against comparing it directly with annual industry statistics: coverage differs and the dataset may include free bets and bonuses. Source: operator data published February 2026.
That older quarter is an illustration, not a replacement for the newer annual report. It shows how different measures can tell different stories within one reporting period. It does not prove that one product caused another to decline.
The percentage is only half the story
My starting point when reading a growth claim is the denominator. A percentage without its starting value is a description with its scale removed. It may be mathematically correct and still leave the reader with the wrong impression.
Take two hypothetical product lines. One rises from £10 million to £12 million; another rises from £100 million to £110 million. The first grows by 20%, the second by 10%. Yet the second adds £10 million, five times the first line's £2 million increase. Calling the first the more important growth engine requires an argument about what “important” means.
A sharp increase can also follow an unusually weak comparison period. That does not invalidate the increase. It means the previous period deserves as much attention as the latest one. A longer, consistently defined series is more informative than a selected pair of endpoints.
Percentage change = (new value − old value) ÷ old value × 100; Product A: (£12m − £10m) ÷ £10m × 100 = 20%; Product B: (£110m − £100m) ÷ £100m × 100 = 10%
More revenue does not necessarily mean more gambling
Consider a simplified hypothetical example. £100,000 of stakes produces £4,000 of stakes less payouts in one period and £6,000 in another. The retained amount has increased by 50%, while stakes have not changed.
This is arithmetic, not a reconstruction of the British figures. It cannot identify why a real operator's results changed. Nor does it make the observed retention rate a game's theoretical RTP or a stable forecast for the next period.
For sports betting, a reader would need evidence about results, prices and stakes before attributing a revenue movement to demand. For casino activity, product mix and the distribution of outcomes also need examination. An aggregate revenue total cannot settle those questions.
Period A: £100,000 stakes − £96,000 payouts = £4,000; Period B: £100,000 stakes − £94,000 payouts = £6,000; Change: (£6,000 − £4,000) ÷ £4,000 × 100 = 50%
Accounts are a weak shortcut for audience size
“Customers” sounds more tangible than “accounts”, which is precisely why substituting one for the other matters. A person may hold accounts at several operators. Without a documented method for identifying distinct people, adding accounts does not establish a population count.
The time window matters too. An account active at least once over a year is a different measure from an account active in a particular month. Adding twelve monthly totals would count a regularly active account repeatedly. Comparing either figure with registrations introduces a third definition.
Before making an audience claim, I would want the activity threshold, period and treatment of multiple accounts stated alongside the number. If they are absent, there is insufficient data to say how many individual people the figure represents.
Cash growth and purchasing power are different questions
A larger monetary total does not establish an equivalent increase in real activity. Inflation adjustments require a stated, appropriate price measure. They should not be improvised from an unrelated headline.
For a hypothetical illustration, a monetary series growing by 10% against a suitable price measure rising by 5% would grow by approximately 4.76% after that adjustment. Subtracting the percentages gives an approximation, not the exact result.
Neither input here is a claim about current British inflation or the gambling market. The example makes the additional assumption visible. It does not prescribe a particular deflator for gambling revenue.
Adjusted growth = [(1 + nominal growth) ÷ (1 + price growth) − 1] × 100; [(1.10 ÷ 1.05) − 1] × 100 ≈ 4.76%
A regulated-market total is not a worldwide census
Geography is part of the measurement. A release about one licensed market cannot establish worldwide demand. It cannot automatically describe unlicensed activity or another jurisdiction with different reporting rules.
International rankings need particular care. Before comparing countries, check whether each series includes the same products, covers the same period and measures the same financial concept. Converting both totals into dollars does not repair incompatible definitions. Exchange-rate movements can also change a converted total without changing its original-currency value.
Forecasts require a separate standard of scrutiny. A projection depends on a model and its assumptions. It should identify the starting year, endpoint, currency basis, coverage and method. A compound annual growth rate smooths the distance between two values; it does not promise that each intervening year follows that path. When the methodology is unavailable, the forecast deserves less editorial weight.
What growth cannot tell a customer
Industry revenue is not evidence that a particular operator processes withdrawals reliably, explains its terms clearly or handles disputes fairly. Those claims require separate evidence. A growing market can contain services with very different practices.
Gross gambling yield is also not a company's bottom-line profit. Business costs, taxes and other items must be considered before reaching a profit figure. Treating a sector total as money available to shareholders skips that work.
Market growth does not improve the mathematical terms of a particular bet. A larger industry does not supply a probability estimate, remove a bookmaker's margin or alter a game's rules. The customer still faces the actual price, conditions and uncertainty of the transaction.
My editorial judgment is that coverage should begin with these distinctions. They should not be attached as an afterthought to an enthusiastic market-size headline. A number can be accurate while the conclusion suggested by its presentation remains unsupported.
Correlation is not an explanation
A revenue increase following a product launch or a rule change does not, on its own, establish causation. Other conditions may have changed during the same period. A credible explanation needs a comparison that addresses those alternatives, not simply two events placed next to each other.
The same standard applies to negative conclusions. A fall in one reported series does not establish that customers have stopped gambling, moved elsewhere or become safer. Each explanation requires evidence beyond the fall itself. Where the data cannot distinguish between them, the honest conclusion is that the cause remains unresolved.
A practical reading checklist
Where calculators help, and where they stop
Market totals cannot supply the inputs for an individual calculation. An RTP estimate needs the game's stated theoretical return and the amount wagered. An odds calculation needs the actual prices for a defined market. A national revenue figure supplies neither.
The RTP Loss Calculator can illustrate an expected result under stated inputs. It cannot predict a session. Our explanation of bookmaker margin covers a different mechanism: the probability implied by quoted odds. Neither tool turns an industry growth rate into a personal opportunity.
What to check before sharing a growth headline
Find the original release and record its geography, reporting dates, measure and operator coverage. Check whether a percentage compares equivalent periods. Read the account-counting notes before describing accounts as people. Keep forecasts separate from observed results.
If those details are missing, the headline is not yet specific enough to support a useful comparison. Ask for the underlying table before repeating the claim.
Practical checklist
- Name the measure. Keep stakes, deposits, yield, profit and account counts separate.
- Match the comparison. Check period length, geography, products and reporting coverage.
- Keep the starting value. Show the absolute change alongside the percentage.
- Read the notes. Look for revisions, bonus treatment and changes in definitions or participating operators.
- Separate observation from explanation. A rise is a finding; its cause needs additional evidence.
- State what remains unknown. Avoid turning incomplete data into claims about individual people, safety or future returns.
Sources and further reading
Fact-checked: . External sources open in a new tab.
- Annual industry statistics: April 2025 to March 2026Gambling Commission
- Operator data: October to December 2025Gambling Commission